zWorkload Reporter
Mainframe Performance Analysis
The zWorkload Reporter is a simple tool for visualizing the MSU consumption of your mainframe, along with all performance data and many other parameters. Combined with the knowledge of your mainframe system’s performance, the diagrams allow you to take and check WLM decisions at any time, as well as performing root cause analyses.
zWorkload Reporter (zWR)
We offer the zWorkload Reporter as a managed service. This means we take care of it entirely, freeing up your staff and hardware resources. All you have to do is install our compression tool and send secured SMF data to our SVA server. We then take care of data processing, maintenance and monitoring. Each client receives a secured and isolated virtual zWR instance, complete with its own database and web server.
You can access the system via your browser, allowing you to use your data any time. Unlike many other mainframe reporting applications that use ready-made reports, the reports in zWR are all generated in real time from the databases.
Clear visualization
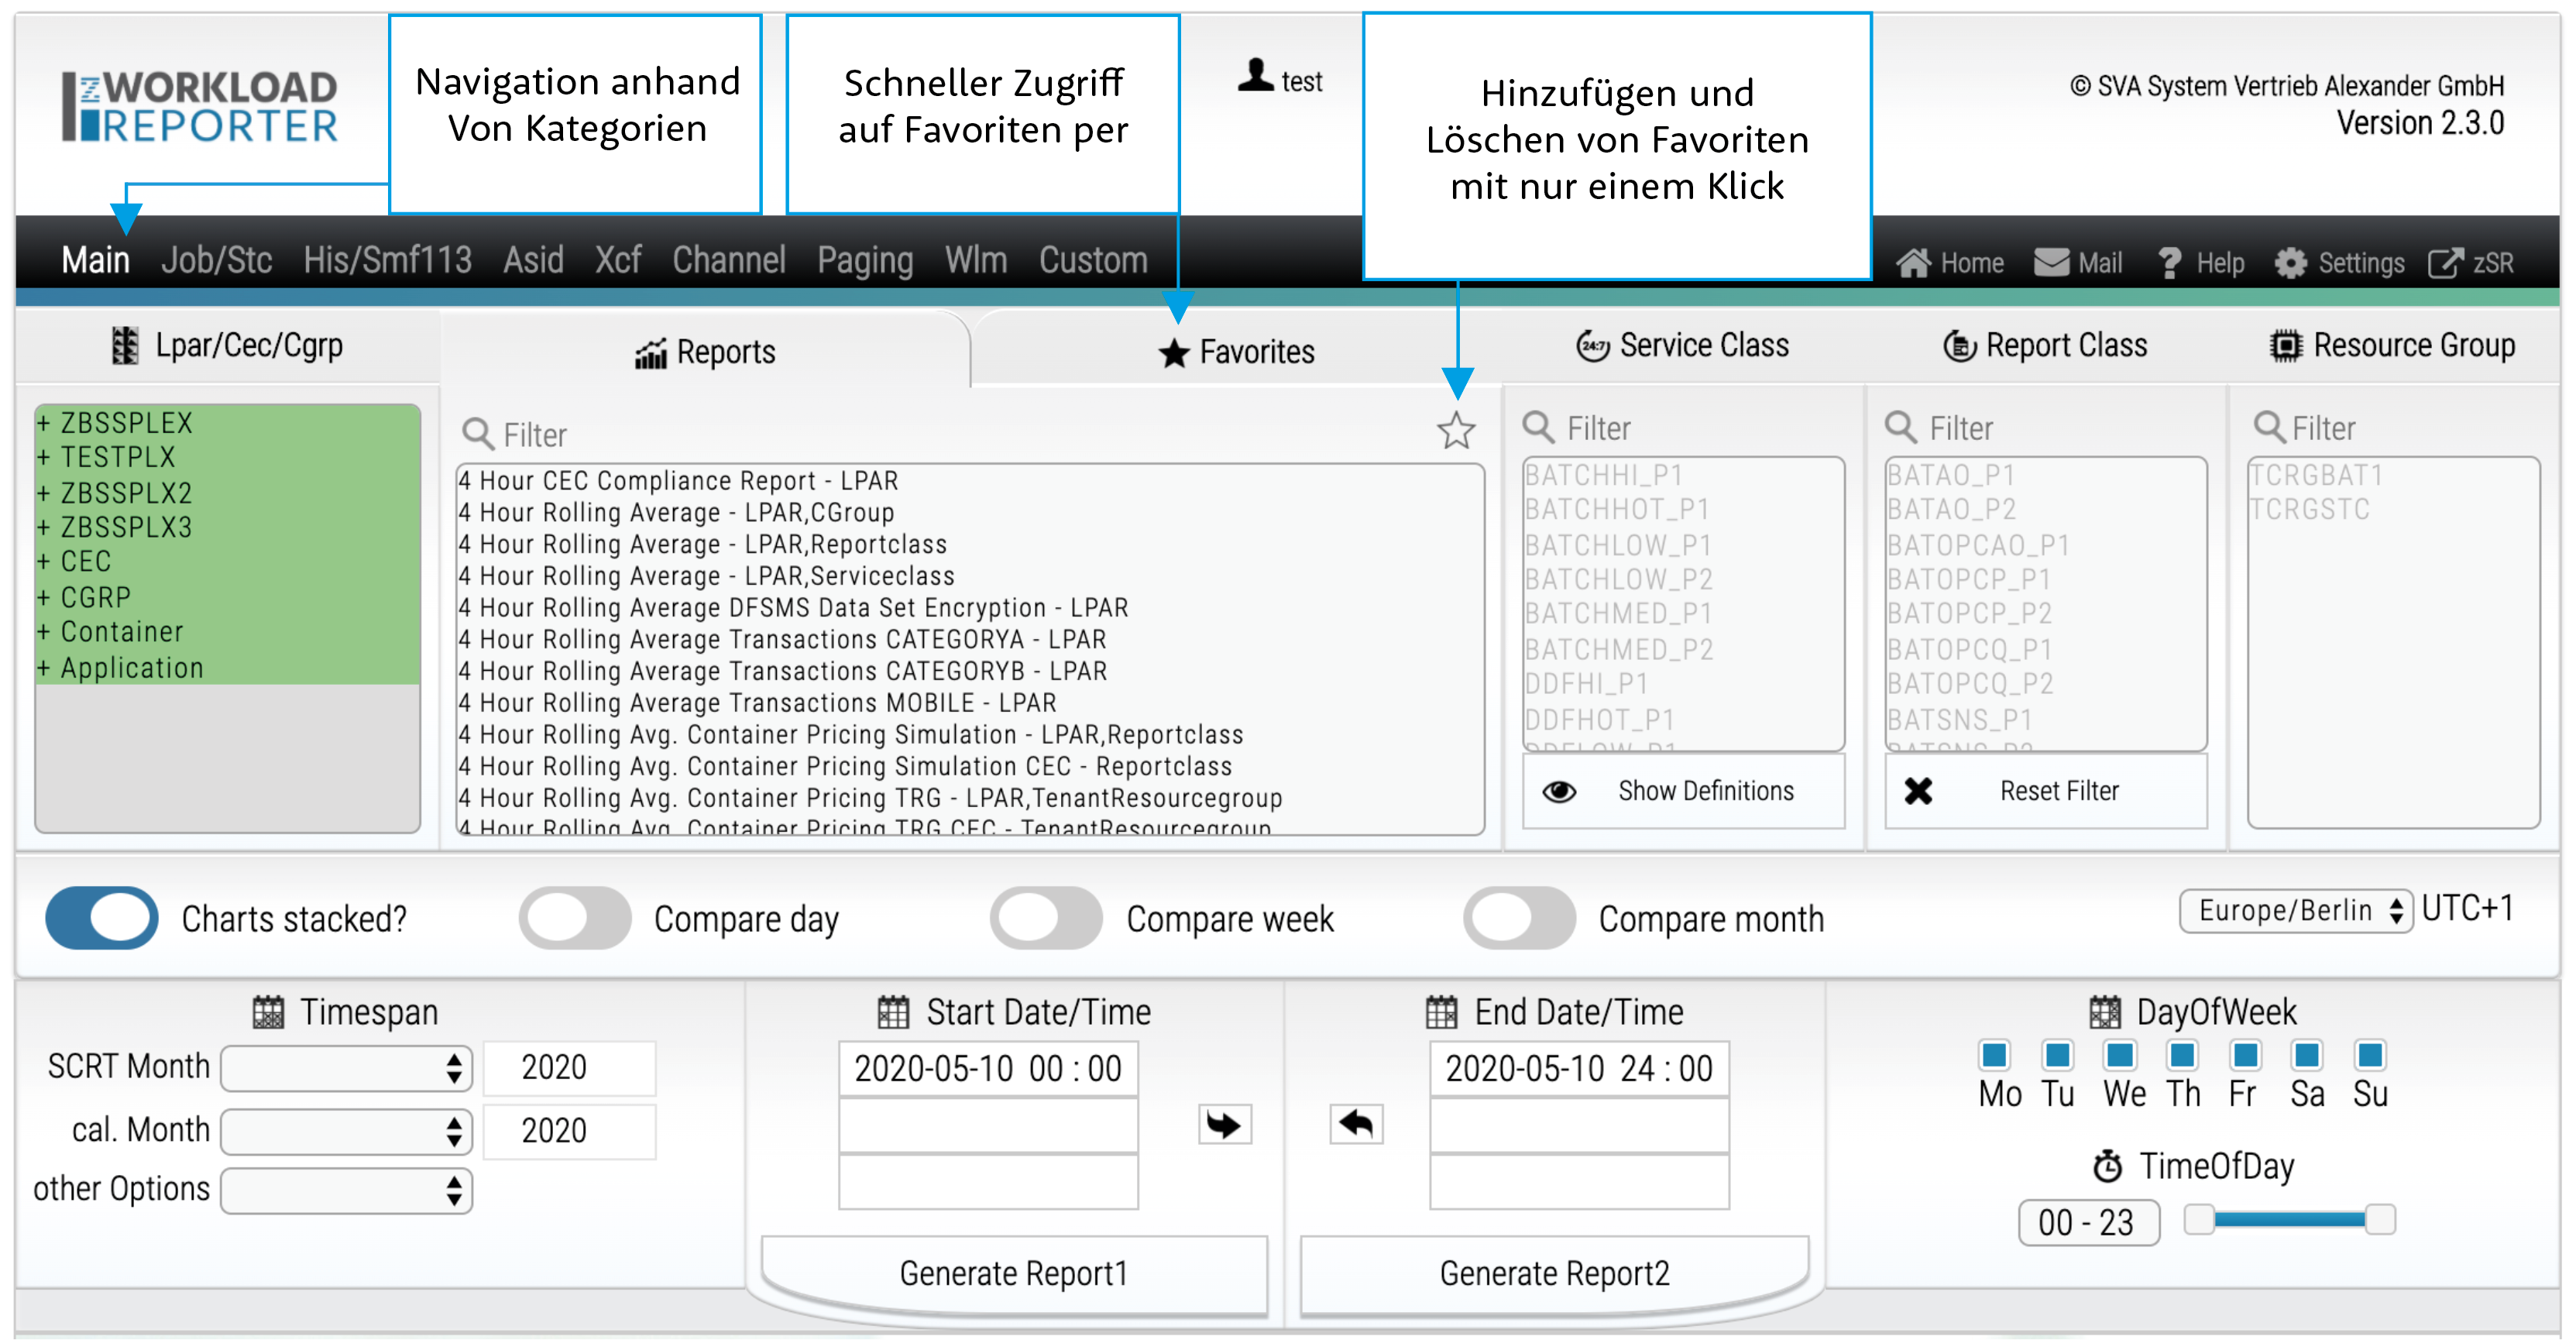
With just a few clicks, the zWorkload Reporter can show you the MSU consumption of all your mainframes, LPARs, workloads, jobs and started tasks using insightful diagrams.
The user interface is designed to be intuitive while still offering all the filtering options you could ever need. You can also easily add reports to your favorites. Advanced users, meanwhile, can create as many favorites lists as they wish and name them accordingly. This means you can always access the reports you need to achieve your analysis objective immediately, without having to search through all 700 of them.
Last but not least, zWorkload Reporter is easy to use and easy to learn.
Reporting
Over 700 reports from eight categories give you insights into every metric you can think of. Here are just a few:
| MSU consumption and 4h rolling average | CEC, LPAR, capacity groups, containers, service classes, tenant resource groups, applications, jobs and started tasks |
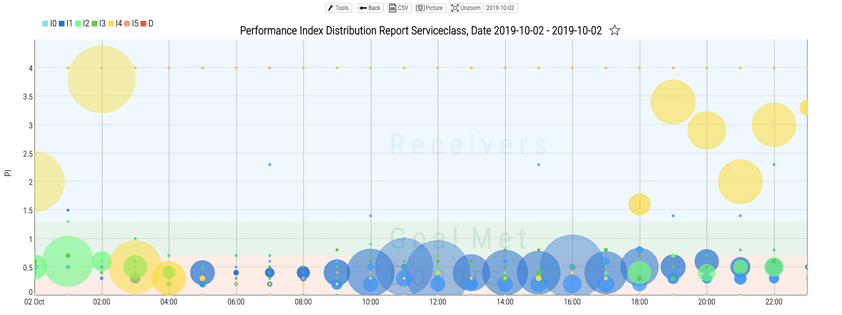
| WLM performance | Performance index, transaction buckets |
| Hardware | RNI, cycles per instruction, weightings |
| Sysplex (XCF) | Structures and signaling, coupling facility |
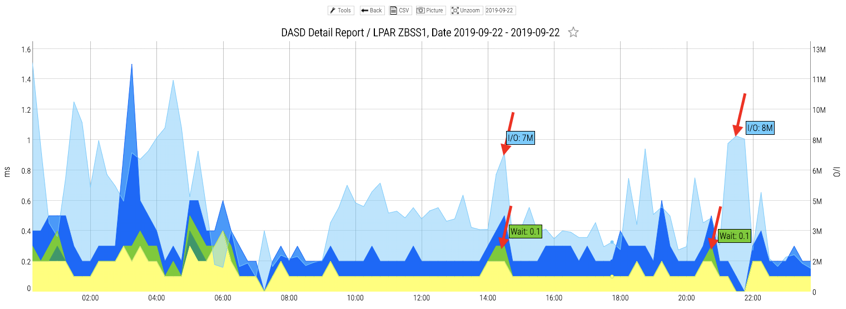
| DASD | IO and response times |
| Channels | Fibre Channel, open systems adapter (OSA), ICP |
| Job/STC | MSU-Verbrauch, Top 10, 4h Rolling Average |
| MSU consumption and 4h rolling average/td> | CEC, LPAR, capacity groups, containers, service classes, tenant resource groups, applications, jobs and started tasks |
| Job/STC | MSU consumption, top 10, 4h rolling average |
| zIIP MSU and zIIP overflow to GCP | CEC, LPAR, containers, service classes, applications, jobs and started tasks |
Visualize your applications
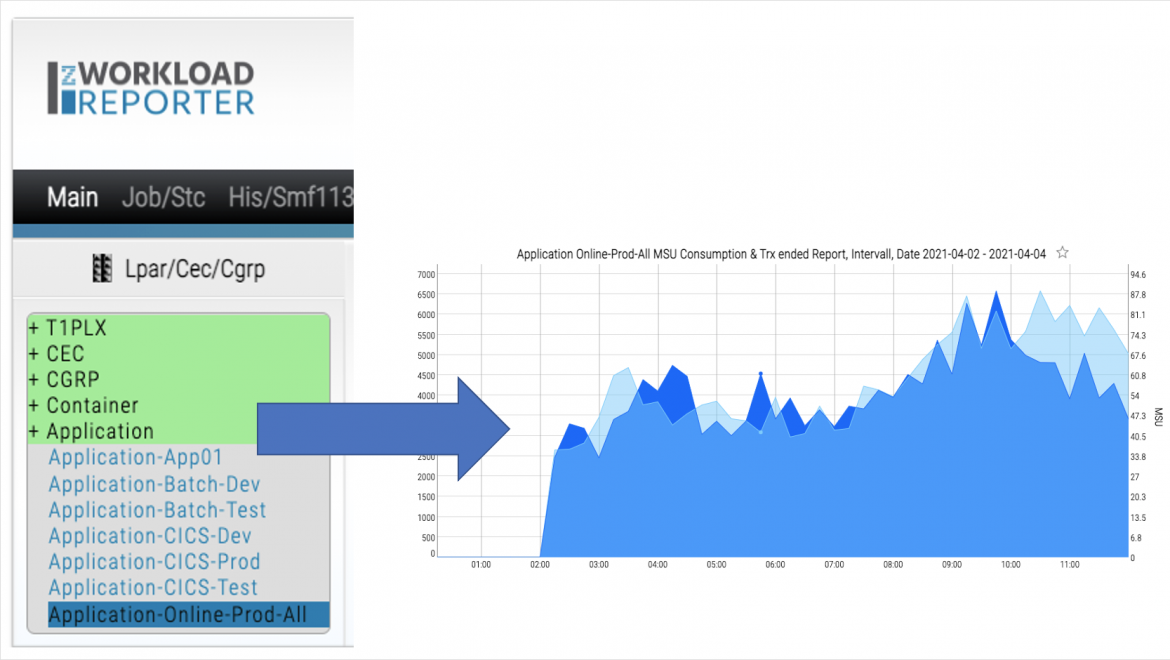
One popular feature is the use of applications for reporting. Many clients operate application environments stretching over multiple z/OS systems that include things like DB2 databases, CICS systems and batch jobs. zWR lets you map out your applications logically within seconds – all you have to do is set a name and add the workloads by selecting as many z/OS system and reporting class pairs as you need.
Containers
You can also map out your containers. Just as with applications, you can give your containers names and add z/OS systems. This allows you to group DevTest containers, Country Multiplex systems or z/OS systems according to customer, for example. Grouping is always logical and can be changed at any time you see fit.
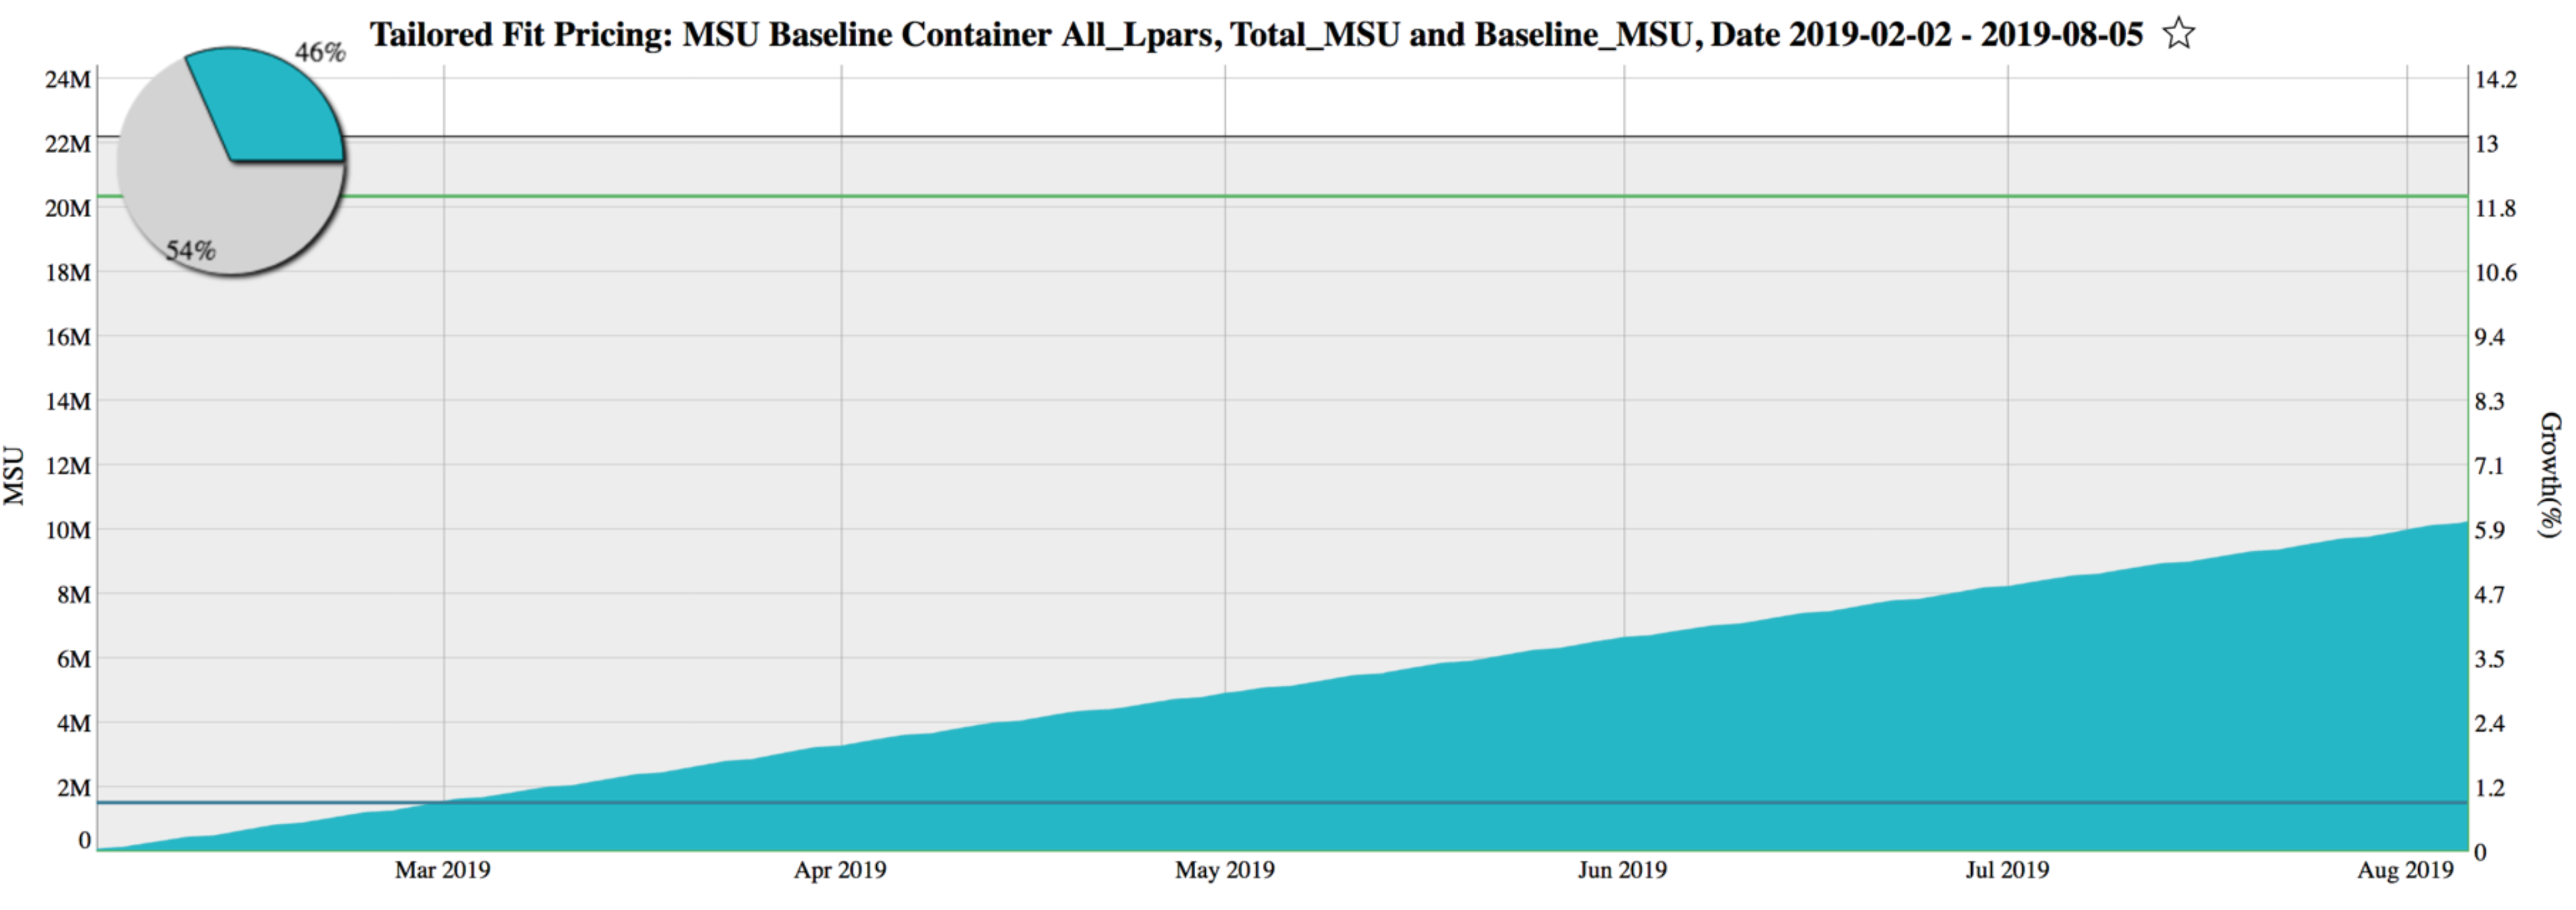
Tailored fit pricing
We have invested a lot of time in supporting clients with countless reports, with the introduction and management of Tailored Fit Pricing, and in particular with the consumption model. These all make the zWorkload Reporter the perfect tool for you.
The zWR can provide answers to two important questions
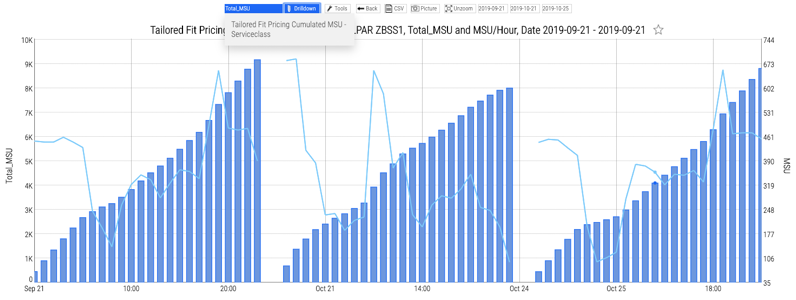
With this purpose in mind, you can define Tailored Fit Pricing containers together with the baseline. Our reports then make it easy to display your previous MSU consumption, baseline and calculated growth rate compared to the same period from the previous year. The pie chart clearly shows the consumed percentage of the baseline MSU.
When it comes to Tailored Fit Pricing, it is always important to keep an eye on the workload of your systems. This allows you to detect unusual behavior before it impacts your costs.
Unlike MLC pricing, in which you only have to manage one peak hour per month, Tailored Fit Pricing means that every single hour of every single day counts.
Report examples
Any Questions?
If you would like to know more about this subject, I am happy to assist you.
Zum Kontaktformular